

IN THIS SITE...

Organisational changes over time
Since the first collection of HES figures in 1989-90 there have been considerable organisational changes within the NHS. This article provides information and examples of the main changes that have taken place to date.
1989-90 to present
For the 1989-90 data year the structure of the NHS was as follows:
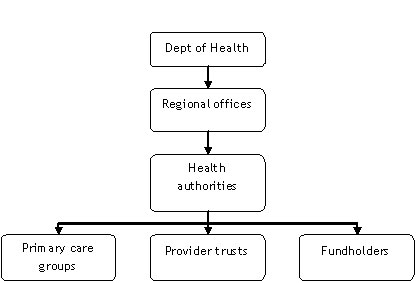 |
At the time of writing this article, the structure of the NHS has simplified to:
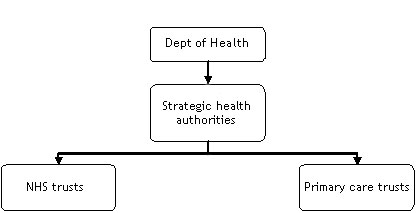 |
Primary care groups and primary care trusts
Primary care groups (PCGs) were introduced in April 1999 when family health services authorities ceased to exist. There were initially 481 PCGs. In April 2000, 17 primary care groups became primary care trusts (PCTs).
NHS PCTs are English statutory bodies, part of the National Health Service, that are responsible for delivering health care and health improvements to their local area. Collectively, PCTs are responsible for spending around 80% of the total NHS budget.
PCTs have their own budgets and set their own priorities, within the overriding priorities and budgets set by the relevant strategic health authority they belong to and the Department of Health. They directly provide a range of community health services: they provide funding for general practitioners and medical prescriptions; they also commission hospital and mental health services from appropriate NHS trusts or from the private sector.
There were 303 PCTs in place by 2002 (often following the merger of two or more PCGs). On 1 October 2006, the number of PCTs was reduced further to 152.
District health authorities, health authorities and strategic health authorities
Prior to 1996 the NHS was organised according to regional health authorities (RHAs), of which there were 14. This was reduced to 8 in 1994.
In 1996, district health authorities merged with family health services authorities to form NHS health authorities (HAs). The number of HAs began to fall as the number of PCTs increased.
In 2002, the number of RHAs were reduced from 8 to 4 (North, South, Midlands and East, and London) and became regional directorates of health and social care for a short time. In 2002, the existing NHS health authorities were renamed and merged to form the 28 new strategic health authorities (SHAs). In July 2006 these SHAs were further reorganised and their number reduced from 28 to 10 by simple merging.
Example
Figure 1 (below) provides a fictional example of how organisational structures may have changed over time. The figures in brackets are the number of episodes each organisation experienced in the previous financial year.
In the figure, South Coast SHA contains four primary care trusts while South Mainland SHA contains three. It also shows how some PCTs merged to create new PCTs that covered a larger area of the country, while others partially separated off and merged to create new PCTs. Particular points to note are that:
- Hudtown PCT and Hudway PCT have retained their names, but have both changed in size: this could lead to misinterpreting subsequent data as a reduction in hospital activity rather than change in geographical area.
- Riverside PCT covers the area previously covered by West River PCT and North River PCT: not knowing about this change could again lead to misinterpretations.
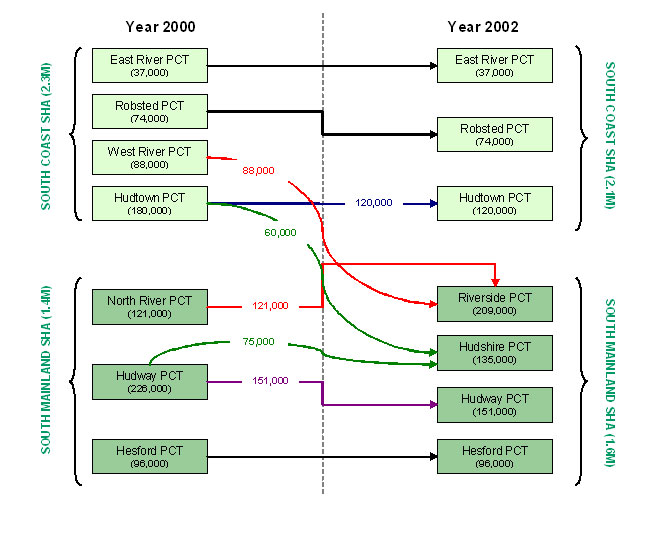 |
Note: the figures for the primary care trusts (PCTs) will not necessarily add up to the totals for the strategic health authorities (SHAs) as SHAs typically encompass a greater number of PCTs.
Points to note
Data quality of 'PCT of GP practice' and 'SHA of GP practice' in 1997-98 and 1998-99 is also poor, with a high proportion missing values where practices changed or ceased to exist.
The quality of the data on derived fields SHA of Treatment in 1996-97, 1997-98 and 1998-99 and PCT of Treatment in all years is very poor. PCT of Responsibility and PCT of Residence provide far more reliable and consistent results.