

IN THIS SITE...

Provisional monthly HES data for outpatients1
This is the most recent publication of provisional2 monthly HES (Hospital Episode Statistics) data for NHS Hospitals in England and activity performed in the Independent sector in England commissioned by English NHS. Further details about the publication of monthly HES are in the 'about monthly HES data' document which can be found under Related Documents.
Key facts
In the year from January 2011 to December 2011 there were:
- 89.4 million outpatient appointments made, with 71.5 million (80.0%) of these attended by the patient.
- 6.8 million outpatient appointments not attended by the patient, representing 7.6% of all appointments.
Outpatient Monthly Activity by appointment type
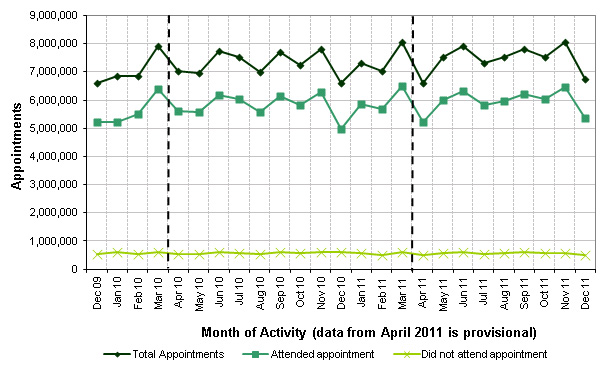 |
Please note: Total appointments include: attendances, did not attend and cancellations (by either the hospital or patient).
| Rolling 12 month period comparison | |||
|---|---|---|---|
| Jan 10 to Dec 10 | Jan 11 to Dec 11 | % change | |
| Total Appointments3,4 | 87,179,784 | 89,376,827 | 2.5% |
| Attended appointments | 69,345,232 | 71,489,870 | 3.1% |
| % of all appointments | 79.5% | 80.0% | - |
| Did not attend appointment | 6,938,444 | 6,758,230 | -2.6% |
| % of all appointments | 8.0% | 7.6% | - |
| Follow-up attendances for each first attendance | 2.27 | 2.32 | - |
| Year to date comparison | |||
|---|---|---|---|
| Apr 10 to Dec 10 | Apr 11 to Dec 11 | % change | |
| Total Appointments3,4 | 65,576,920 | 66,955,242 | 2.1% |
| Attended appointments | 52,206,372 | 53,430,278 | 2.3% |
| % of all appointments | 79.6% | 79.8% | - |
| Did not attend appointment | 5,185,009 | 5,059,353 | -2.4% |
| % of all appointments | 7.9% | 7.6% | - |
| Follow-up attendances for each first attendance | 2.27 | 2.30 | - |
Footnotes
1. Outpatient: Those treated within hospital but not admitted as an inpatient.
2. Provisional data: The data is provisional and may be incomplete or contain errors for which no adjustments have yet been made. Counts produced from provisional data are likely to be lower than those generated for the same period in the final dataset. This shortfall will be most pronounced in the final month of the latest period, e.g. November from the (month 9) April to November extract. It is also probable that clinical data are not complete, which may in particular affect the last two months of any given period. There may also be errors due to coding inconsistencies that have not yet been investigated and corrected.
3. Appointment count: The number of planned/booked appointments for outpatients. The HES database contains one row per appointment that was made, whether it was attended or not.
4. Attendance Type: Attendance Type identifies whether the patient:
- Attended an appointment (these figures are shown in the above table under the heading 'attended appointment')
- Did not attend the appointment, which means the patient did not arrive for their specified appointment (these figures are shown in the above table under the heading 'did not attend appointment')
- Hospital or patient cancelled the appointment (these figures are not shown in the above table).
Outpatient data quality: Outpatient Hospital Episode Statistics (HES) data were collected for the first time in 2003-04 and data quality, particularly for clinical information, remains poor. It is not mandatory for providers to code procedures and diagnoses on outpatient records and therefore the coverage of clinical information is low. The poor coverage may in part be accounted for by the fact that there may be no appropriate OPCS-4 code available, or that the cause of morbidity was unknown. In 2009-10 around 3% of records had a known cause of morbidity and 16% of records had completed or appropriate OPCS-4 procedure codes. We have no reliable existing data source to validate this data against, as Department of Health aggregate returns have never collected clinical codes; it is not clear how representative the figures are. The data represents a sample of outpatient attendances. Statistical estimates (such as median and 90th percentile waiting times for main operations) must be regarded as potentially unreliable until it is possible to assess the quality of local coding.
Assessing growth through time: HES figures are available from 2003-04 onwards. Changes to the figures over time need to be interpreted in the context of improvements in data quality and coverage (particularly in earlier years), improvements in coverage of independent sector activity (particularly from 2006-07) and changes in NHS practice. For example, apparent reductions in activity may be due to a number of procedures which may now be undertaken in outpatient settings and so no longer include in admitted patient HES data.
Activity included: Activity in English NHS Hospitals and English NHS commissioned activity in the independent sector.
Source statement: Source: Hospital Episode Statistics (HES), The Health and Social Care Information Centre.
Responsible statistician
The responsible statistician for this publication is Chris Dew, HES/SUS Analysis (Service) Section Head ([email protected], 0845 300 6016).
Copyright statement
The copyright to the information we are disclosing is held by the Health and Social Care Information Centre. The HSCIC has suspended the application of re-use licence fees as a consequence of government policy ('Making Public Data Public'), so you may re-use this information free of charge. Please ensure that the following copyright statement is included within your documents: 'Copyright � 2012 Re-used with the permission of the Health and Social Care Information Centre. All rights reserved.' Please also use the citation logo available for download from the HSCIC's website.