

IN THIS SITE...

Accident and Emergency - Patient journey: Further analysis of the published 2007-08 A&E; HES data (experimental statistics)
This report is based on the 2007-08 HES dataset and examines the time spent in A&E; in England by patients and their destination on leaving the department. During the period covered by the 2007-08 A&E; publication not all NHS providers completed data submissions and data quality was considered to be poor in some cases. The Hospital Episode Statistics (HES) data available for analysis shows that, in 2007-08:
- For approximately three quarters (73%) of patients (where records were available) their visit to A&E; was completed within three hours; 96% were completed within four hours.
- The number of patients leaving the A&E; department per minute increased as time spent approached 4 hours; 6% left in the last 10 minutes.
- Of all A&E; patients, 41% were discharged with no follow-up required while a further 21% were admitted to hospital.
- As time spent increased the percentage of patients discharged with no follow-up required fell while the percentage admitted increased.
- Of those leaving the department, the percentage of patients admitted to hospital peaked between 3 hours 51 minutes and 4 hours.
NHS organisations will be able to review their own data to ascertain the extent to which their local trend follows this national pattern. This can be done by using the accompanying interactive spreadsheet (Supporting Provider level A&E; analysis 2007-08, see below).
Analysis
Time spent in A&E; is derived from the HES dataset by subtracting the A&E; departure time from the arrival time, both of which are available to the nearest minute.
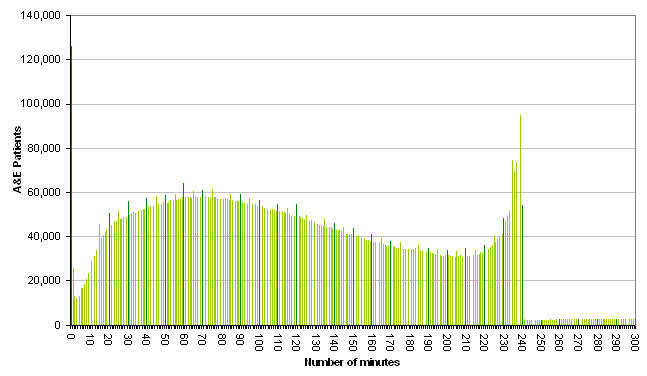
Chart 1 illustrates the reported time patients spent in A&E; in England. It is broken down into minute intervals to demonstrate the key underlying trends.
The large spike at zero minutes is likely to be due to a combination of two factors: patients who simply pass through A&E; who are immediately admitted and data quality issues with certain providers submitting the default time of 00:00 on their systems.
After zero minutes the graph climbs towards a peak of approximately 70 minutes as providers report an increase in the number of patients they are dealing with. Patient departures begin to fall off after the peak at 70 minutes. The fall continues until the 200 minute (03:20 hrs) mark when the number of departures again starts to increase finally reaching a peak at 239 minutes (03:59 hrs), the most rapid increase happening between 231 and 239 minutes (03:51 and 03:59 hrs).
Chart 1: Accident and Emergency attendances in England 2007-08 (Experimental Statistics): Distribution of A&E; attendances by total time spent (by minute)
 |
Further information is available within the full report:
Responsible statistician
The responsible statistician for this publication is Tony Childs, Principal Information Analyst HES/SUS ([email protected], 0845 300 6016).
Copyright statement
The copyright to the information we are disclosing is held by the NHS Information Centre. The NHS Information Centre has suspended the application of re-use licence fees as a consequence of government policy ('Making Public Data Public'), so you may re-use this information free of charge. Please ensure that the following copyright statement is included within your documents: 'Copyright � 2011 Re-used with the permission of The Health and Social Care Information Centre. All rights reserved.' Please also use the citation logo available for download from The IC's website.