

IN THIS SITE...

A decade in view
Hospital Activity: A decade in view
By collecting millions of detailed records about NHS hospital treatment since 1989, Hospital Episodes Statistics (HES) is in a unique position to illustrate trends, reveal changes brought about by central directives, and the effects of developments in medical science.
Hospital activity data collected during the last decade (2000-01 to 2009-10), and shows some trends in key measures such as mean length of stay, admissions, surgical procedures undertaken and the median time waited.
Over the last decade, data has been collected about over 136 million hospital admissions and over 82 million surgical interventions or procedures.
The data provided (below) includes all inpatient care (including day case surgery) is included, but does not include outpatient attendances or visits to A&E; departments where the patient is sent straight home after treatment.
| Table 1: A profile of HES activity over the period 2000-01 to 2009-10 | |||||
|---|---|---|---|---|---|
| Years | Admissions | Procedures† | Mean LS (Spells) | Mean Age (years) | Median Time Waited (days) |
| 2000-01 | 11,116,160 | 6,509,425 | 8.2 | 48 | 44 |
| 2001-02 | 11,077,270 | 6,435,022 | 8.1 | 48 | 47 |
| 2002-03 | 11,372,571 | 6,612,582 | 7.9 | 49 | 49 |
| 2003-04 | 11,809,017 | 6,772,074 | 7.4 | 49 | 50 |
| 2004-05 | 12,101,986 | 6,847,589 | 7.1 | 49 | 52 |
| 2005-06 | 12,678,628 | 7,215,286 | 6.6 | 49 | 51 |
| 2006-07 | 12,976,273 | 7,888,074 | 6.3 | 49 | 49 |
| 2007-08 | 13,479,828 | 8,606,493 | 5.7 | 50 | 42 |
| 2008-09 | 14,152,692 | 9,274,423 | 5.7 | 50 | 35 |
| 2009-10 | 14,537,712 | 9,747,584 | 5.6 | 51 | 34 |
| % change (2000-01 to 2009-10) | 30.8% | 49.7% | -31.7% | 6.3% | -22.7% |
The numbers of admissions and the operations undertaken in hospital have generally been rising over the period under review; with relative rises (between 2000-01 and 2009-10) of approximately 30 and 50 per cent, respectively. The rise in the average age of admitted patients from 48 to 51 years is almost certainly due to increased longevity, and raises questions about the additional resources needed to tackle the health needs of an ageing population.
Chart 1: A profile of HES activity over the period 2000-01 to 2009-10 (indexed 2000-01 = 100)
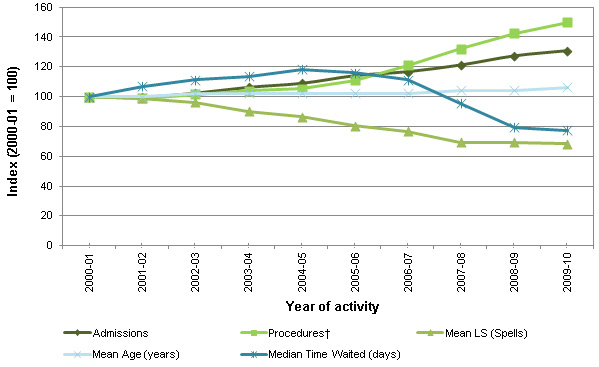 |
†Please note that the number of procedures in the graph above represents a count of episodes that had at least one procedure. If an episode had more than one procedure, it is only counted once.
Waiting lists, and times, are often in the news. HES collects the date on which a consultant (or equivalent healthcare professional) decides that a person should be admitted for treatment, and also the date of eventual admission. Note that this time is not reduced to take account of suspensions, for example, a person who goes away on holiday may be temporarily removed from the waiting list. The patient will normally be referred to a consultant by their GP, but HES does not collect the time between seeing the GP and the appointment with the consultant.
The average median time waited has had a range of 18 days over the past decade, and in 2009-10 the median time waited was 34 days, 10 days lower than it was in 2000-01.
| Table 2: Median Time Waited (days) for named procedures or interventions | ||||
|---|---|---|---|---|
| Year | Coronary artery bypass graft1 | Varicose vein surgery2 | Cataract3 | Hip replacement4 |
| 2000-01 | 180 | 162 | 154 | 212 |
| 2001-02 | 153 | 159 | 145 | 220 |
| 2002-03 | 134 | 181 | 140 | 229 |
| 2003-04 | 91 | 170 | 124 | 217 |
| 2004-05 | 92 | 144 | 78 | 182 |
| 2005-06 | 65 | 134 | 68 | 158 |
| 2006-07 | 68 | 126 | 69 | 148 |
| 2007-08 | 65 | 88 | 64 | 107 |
| 2008-09 | 54 | 63 | 56 | 75 |
| 2009-10 | 45 | 65 | 57 | 77 |
Source: Hospital Episode Statistics (HES), The NHS Information Centre for Health & Social Care
In addition to the overall trends in median times waited before operations, table 2 (above) shows how the median time waited has changed for specific operative procedures. The table indicates that waiting times have been falling over the years for these procedures.
Overall, a little more than 3.2 million more procedures or inventions were performed in 2009-10 compared to ten years earlier, a rise of nearly 50 per cent (see table 1). There are wide variations in Individual named surgical procedures (see table 3). The fall in the numbers of some minor procedures and examinations may be due to a greater proportion of these now being performed in an outpatient setting (outpatients are not included below).
| Table 3: Changes in the number of finished consultant episodes for named procedures or interventions; 2000-01 and 2009-10 | |||
|---|---|---|---|
| Operations | 2000-01 | 2009-10 | %change |
| Coronary Artery bypass Graft1 | 23,181 | 20,818 | -10.2% |
| Varicose Vein Surgery2 | 45,327 | 36,209 | -20.1% |
| Cataract3 | 112,105 | 158,229 | 41.1% |
| Hip Replacement4 | 253,833 | 348,660 | 37.4% |
| Caesarean Delivery5 | 70,258 | 101,020 | 43.8% |
| Other | 6,004,721 | 9,082,648 | 51.3% |
Source: Hospital Episode Statistics (HES), The NHS Information Centre for Health & Social Care
Footnotes
- All the codes given in this article are from OPCS-4.2 (Office of Population, Censuses and Surveys: Classification of Surgical Operations and Procedures, 4th Revision). Any codes that were additions in OPCS 4.3 or 4.4 are noted. The following codes were used to define the named procedures or inventions:
- Activity: All the reported figures are based on NHS Hospitals England and activity performed in the Independent sector in England commissioned by English NHS)
1.; Coronary; Artery bypass Graft: K40-K46 (OPCS-4.2 onwards)
2.; Varicose; Vein Surgery: L85-L87(OPCS-4.2 onwards), plus L84 and L88 (OPCS-4.3 onwards)
3.; Cataract;: C71-C75 (OPCS-4.2 onwards)
4.; Hip; Replacement: W37-W39 and W46-W48 (OPCS-4.2 onwards), plus W93-W95 (OPCS 4.3 onwards)
5.; Caesarean; Delivery: R17-R18 (OPCS-4.2 onwards)