

IN THIS SITE...

Asthma and allergies
Over the past 10 years, there has been a 6.0% increase in the number of admissions to hospital in England with asthma and allergies. The majority of these patients are either young males or older females (post puberty). This article looks at the related HES data.
What are they and who do they affect?
Asthma is a chronic disease in which the patient's airways constrict, usually in response to an irritant. The symptoms of asthma include wheezing, coughing, breathlessness and a tight chest. For most, the symptoms of asthma can be mild. However, in some individuals the condition can be life threatening and result in hospital admission. According to the World Health Organization, more than half of those affected by asthma are suffering from allergic asthma (caused by an allergic reaction).
Allergies are caused by reactions to normally harmless substances, including pollen, animals and food. The symptoms of allergic reactions are diverse and can vary from minor reactions, such as a runny nose, to life-threatening responses, such as anaphylactic shock. It is usually possible to keep allergies under control by minimising contact with the allergen or by taking drugs that help to alleviate the symptoms. Admission to hospital is usually only necessary for severe allergic reactions.
Are asthma and allergies on the increase?
Over the past ten years, the number of finished consultant episodes (FCEs) with an asthma or allergy diagnosis has increased overall by 6.0%. However, this increase is driven by allergies which over the same period increased by 32.6%. These increases have mainly been in secondary diagnoses* of asthma and allergies and in 2007-08 there were in fact fewer finished admission episodes with a primary diagnosis of asthma than in 1998-99.
The table below shows the number of episodes recorded in HES during 1998-99 and 2007-08 with a primary diagnosis of:
- asthma (J45 and J46 in ICD-10)
- allergy (J30.1, J30.2, J30.3, J30.4, J45.0, K52.2, L23.0, L23.1, L23.2, L23.3, L23.4, L23.5, L23.6, L23.7, L23.8, L23.9, L50.0, L56.1, T78.0, T78.1, T78.2, T78.4, T80.5, T88.6 in ICD-10).
| Episodes in HES for 1998-99 and 2007-08 | |||
|---|---|---|---|
| Primary diagnosis | Year | Finished admission episodes | Finished consultant episodes |
| Asthma | 1998-99 | 70,420 | 80,492 |
| 2007-08 | 63,873 | 81,800 | |
| Allergies | 1998-99 | 12,602 | 13,161 |
| 2007-08 | 16,482 | 17,445 | |
Graphs 1 and 2 show the 'primary diagnosis' (the main reason why the patient was admitted to hospital) and 'all diagnoses' (where the diagnosis is mentioned as either a primary or secondary diagnosis) counts for each year from 1998-99 to 2007-08.
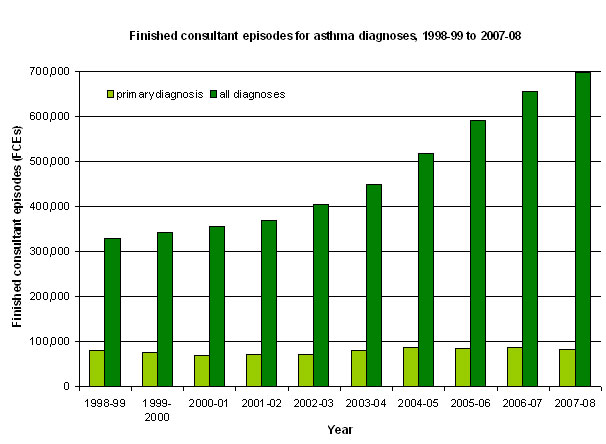 |
Graph 1 (above) shows that the number of FCEs where the primary diagnosis was asthma has remained relatively stable over the past ten years. However, the number of FCEs where any diagnosis included asthma has increased considerably over the same period, almost double.
Graph 2 (below) shows a similar increasing trend in allergy diagnoses from 1998-99 to 2007-08 to that for asthma. An allergy is more likely to be diagnosed as a primary diagnosis; proportionally there are very few secondary diagnoses for allergies.
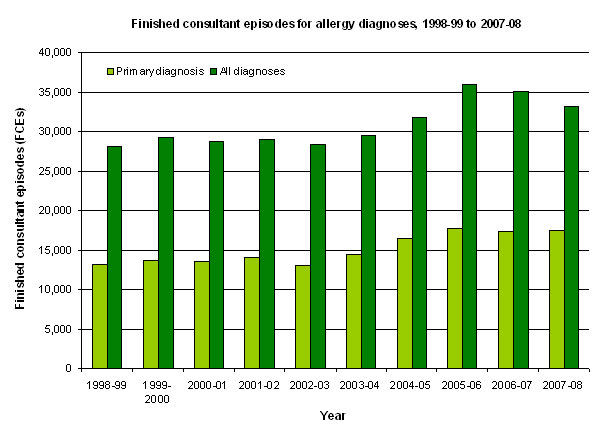 |
The number of FCEs with a primary diagnosis of allergy ranged from 13,039 in 2002-03 to 17,759 in 2005-06 (1998-99 = 13,161). A similar trend can be seen for all diagnosis. In 2002-03 there were 28,383 FCEs for allergies, compared with 35,962 in 2005-06 (1998-99 = 28,052).
It is not possible to draw conclusions about any increase in the prevalence of asthma and allergies from HES data. The increases in the all diagnoses counts of FCEs for asthma and allergies may be affected by changes in clinical coding practices.
Are young people more likely to be admitted to hospital?
Graph 3 (below) shows the age distribution for FCEs with a primary diagnosis of either asthma or allergy for 2007-08. Children under the age of 15 years account for the greatest number of FCEs in both cases.
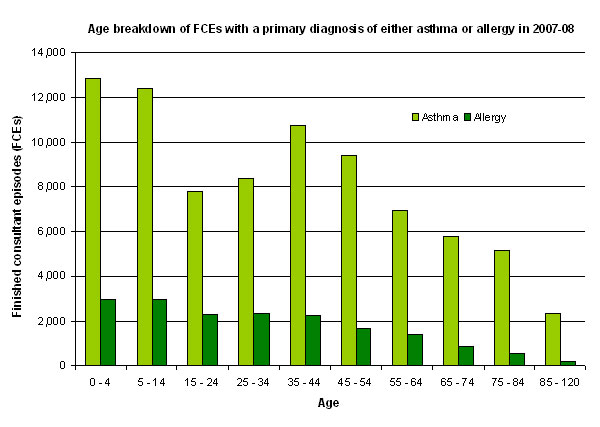 |
For diagnoses of asthma there is a second peak in FCEs for those aged 35-44 years. For diagnoses of allergy there is no second peak, however, the number of FCEs begins to decline for those aged 45 and over.
Over the past ten years (1998-99 to 2007-08), there have been similar trends in the age distributions for asthma and allergy FCEs. However, there have been some notable changes over time:
- There has been a considerable decrease in the number of children aged 0-4 years who were admitted to hospital
- The largest increase in FCEs for asthma was for the 35-44 age group
- The largest increase in FCEs for allergies was for those aged 85 and over
- The greatest number of allergy FCEs for age groups 15-24 and above was recorded in 2007-08.
Is there a difference in the number of males and females admitted to hospital?
Hospital treatment for asthma is more common in boys under 15 years old than girls (see graph 4, below), but at puberty this is reversed so that the condition is more common in women than men. There is a peak in the 35-44 year age group for asthma FCEs of both sexes, but no obvious peak for allergy FCEs.
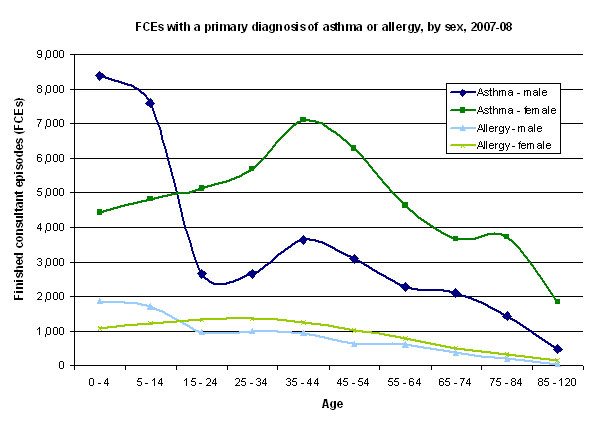 |
Graph 4 (above) shows the trends in male and female FCEs are present in all the data years analysed for this paper (1998-99 to 2007-08). The number of FCEs and graphs exhibiting the trend are available in the two Excel spreadsheets that accompany this article.
Further information
Tables containing the raw data used to create the graphs in this article, along with additional data, are available to download from the Related documents area to the right-hand side of this screen.
For access to further data, please see the Accessing the data area of this website.
* HES definitions
The following definitions have been used in this topic paper:
- Diagnosis (primary diagnosis): The primary diagnosis is the first of up to 14 (7 prior to 2002-03) diagnosis fields in the HES data set and provides the main reason why the patient was in hospital.
- Secondary diagnosis: As well as the primary diagnosis, there are up to 13 (6 prior to 2002-03) secondary diagnosis fields in HES that show other diagnoses relevant to the episode of care.