

IN THIS SITE...

Provisional monthly HES topic of interest: Irritable Bowel Syndrome
NHS Choices1 describes Irritable Bowel Syndrome (IBS) as follows:
'IBS (irritable bowel syndrome) is a common condition of the digestive system and can cause bouts of stomach cramps, bloating, diarrhoea and constipation.
There's no cure for IBS, but the symptoms can be relieved by changing your diet and lifestyle. Sometimes medication can help, too.
IBS isn't a dangerous condition. There's no obvious abnormality of the bowel, and, although it can feel uncomfortable, the condition poses no serious threat to your health. For example, it won't increase your chances of developing cancer or other bowel conditions.
The precise cause of IBS is unclear, but it may be triggered by stress, problems with your immune system or a problem with how the muscles of your gut squeeze food through your bowel.
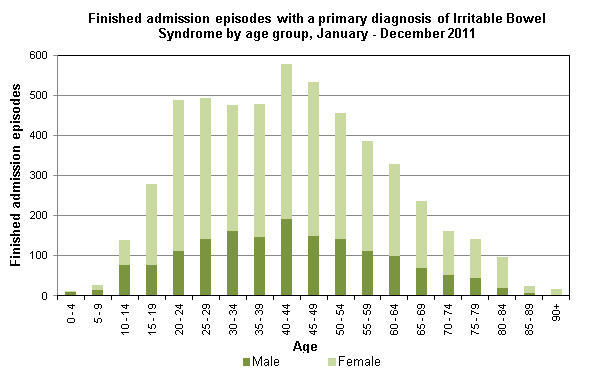
The symptoms of IBS usually come on for the first time between the ages of 20 and 30. They're not usually continuous, but tend to come and go in bouts, often during times of stress or after eating certain foods.
The symptoms can vary from one person to another and be worse in some people than others.'
Key Facts
In the period January to December 2011:
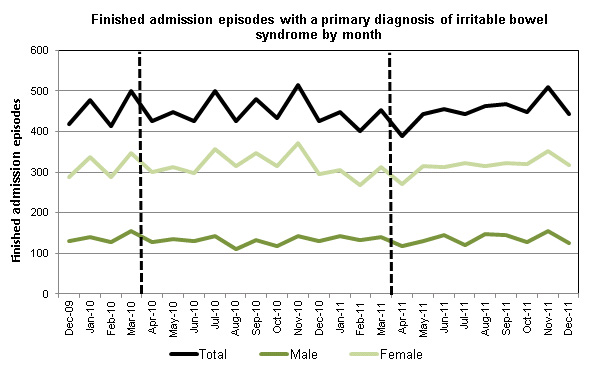
- Irritable bowel syndrome accounted for 5,370 finished admission episodes (FAEs), a 1.9% decrease on the previous 12 month period where there were 5,473 finished admission episodes (FAEs).
- 70 percent of all admissions for IBS were for females.
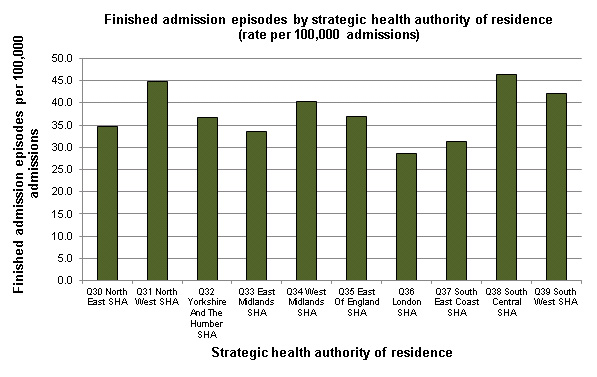
- The highest rate of admissions (per 100,000 FAEs) was in the South Central SHA (46.4 per 100,000), whilst the lowest was in London SHA (28.7 per 100,000).
| Table 1: Admissions by gender | |||
|---|---|---|---|
| Jan-Dec 2010 | Jan-Dec 2011 | % Change | |
| Total (inc. unknown gender) | 5,473 | 5,370 | -1.9% |
| Male | 1,591 | 1,633 | 2.6% |
| Female | 3,881 | 3,735 | -3.8% |
Chart 1: Finished admissions episodes (FAEs) by month and gender
 |
| Table 2: Finished admission episodes (FAEs) by age group - Jan to Dec 2011 (not inc. unknown age or gender) | ||
|---|---|---|
| Age Group | Male | Female |
| 0-4 | 9 | 2 |
| 5-9 | 16 | 12 |
| 10-14 | 77 | 63 |
| 15-19 | 77 | 203 |
| 20-24 | 111 | 377 |
| 25-29 | 142 | 351 |
| 30-34 | 163 | 313 |
| 35-39 | 146 | 332 |
| 40-44 | 192 | 387 |
| 45-49 | 149 | 384 |
| 50-54 | 142 | 314 |
| 55-59 | 111 | 276 |
| 60-64 | 99 | 231 |
| 65-69 | 69 | 167 |
| 70-74 | 51 | 111 |
| 75-79 | 44 | 99 |
| 80-84 | 21 | 76 |
| 85-89 | 7 | 18 |
| 90+ | 2 | 15 |
Chart 2: Finished admissions episodes (FAEs) by age group and gender
 |
| Table 3: Finished admission episodes (FAEs) by strategic health authority of residence (not inc. unknown or other strategic health authorities) | ||
|---|---|---|
| Strategic Health Authority | FAEs | Rate per 100,000 FAEs |
| Q30 North East SHA | 298 | 34.6 |
| Q31 North West SHA | 947 | 44.8 |
| Q32 Yorkshire And The Humber SHA | 560 | 36.6 |
| Q33 East Midlands SHA | 418 | 33.5 |
| Q34 West Midlands SHA | 611 | 40.3 |
| Q35 East Of England SHA | 544 | 37.0 |
| Q36 London SHA | 560 | 28.7 |
| Q37 South East Coast SHA | 338 | 31.2 |
| Q38 South Central SHA | 444 | 46.4 |
| Q39 South West SHA | 621 | 42.2 |
Chart 3: Finished admissions episodes (FAEs) by SHA of residence
 |
| Table 4: Finished admissions episodes by main operative procedure (top 10) | |
|---|---|
| Main operative procedure | FAEs |
| Diagnostic endoscopic examination of colon | 1,895 |
| None | 1,574 |
| Diagnostic endoscopic examination of lower bowel using fibreoptic sigmoidoscope | 1,006 |
| Diagnostic fibreoptic endoscopic examination of upper gastrointestinal tract | 274 |
| Diagnostic imaging procedures | 126 |
| High cost musculoskeletal drugs | 62 |
| Diagnostic endoscopic examination of peritoneum | 56 |
| Breath tests | 53 |
| Diagnostic endoscopic examination of ileum | 47 |
| Continuous Infusion of therapeutic substance | 45 |
Footnotes:
Sources
1. NHS Choices: Irritable bowel syndrome.
Provisional data
The data is provisional and may be incomplete or contain errors for which no adjustments have yet been made. Counts produced from provisional data are likely to be lower than those generated for the same period in the final dataset. This shortfall will be most pronounced in the final month of the latest period, ie December from the (month 10) April to December extract. It is also probable that clinical data are not complete, which may in particular affect the last two months of any given period. There may also be errors due to coding inconsistencies that have not yet been investigated and corrected.
Finished admission episodes
A finished admission episode (FAE) is the first period of inpatient care under one consultant within one healthcare provider. FAEs are counted against the year in which the admission episode finishes. Admissions do not represent the number of inpatients, as a person may have more than one admission within the year.
Primary diagnosis
The primary diagnosis is the first of up to 20 (14 from 2002-03 to 2006-07 and 7 prior to 2002-03) diagnosis fields in the Hospital Episode Statistics (HES) data set and provides the main reason why the patient was admitted to hospital.
ICD-10 Codes used:
- K58 - Irritable bowel syndrome
Main procedure
The first recorded procedure or intervention in each episode, usually the most resource intensive procedure or intervention performed during the episode. It is appropriate to use main procedure when looking at admission details, (eg time waited), but a more complete count of episodes with a particular procedure is obtained by looking at the main and the secondary procedures.
Data quality
Hospital Episode Statistics (HES) are compiled from data sent by more than 300 NHS trusts and primary care trusts (PCTs) in England and from some independent sector organisations for activity commissioned by the English NHS. The Health and Social Care Information Centre liaises closely with these organisations to encourage submission of complete and valid data and seeks to minimise inaccuracies. While this brings about improvement over time, some shortcomings remain.
Assessing growth through time
HES figures are available from 1989-90 onwards. Changes to the figures over time need to be interpreted in the context of improvements in data quality and coverage (particularly in earlier years), improvements in coverage of independent sector activity (particularly from 2006-07) and changes in NHS practice. For example, apparent reductions in activity may be due to a number of procedures which may now be undertaken in outpatient settings and so no longer include in admitted patient HES data.
SHA/PCT of residence
The strategic health authority (SHA) or primary care trust (PCT) containing the patient?s normal home address. This does not necessarily reflect where the patient was treated as they may have travelled to another SHA/PCT for treatment.
Activity included
Activity in English NHS Hospitals and English NHS commissioned activity in the independent sector.
Source statement
Source: Hospital Episode Statistics (HES), Health and Social Care Information Centre
Responsible statistician
The responsible statistician for this publication is Chris Dew, HES/SUS Analysis (Service) Section Head ([email protected], 0845 300 6016).
Copyright statement
The copyright to the information we are disclosing is held by the Health and Social Care Information Centre. The HSCIC has suspended the application of re-use licence fees as a consequence of government policy ('Making Public Data Public'), so you may re-use this information free of charge. Please ensure that the following copyright statement is included within your documents: 'Copyright � 2012 Re-used with the permission of the Health and Social Care Information Centre. All rights reserved.' Please also use the citation logo available for download from the HSCIC's website.